Several new Rmetrics packages
Debian has provided Rmetrics packages for financial engineering and computational finance since the Rmetrics release for R 1.9.0 in the summer of 2004. Over the years, Rmetrics has gotten more granular and changed from a handful of packages to two handfuls --- and the most recent release extended this trend even further to almost two dozen packages as shown in this chart.
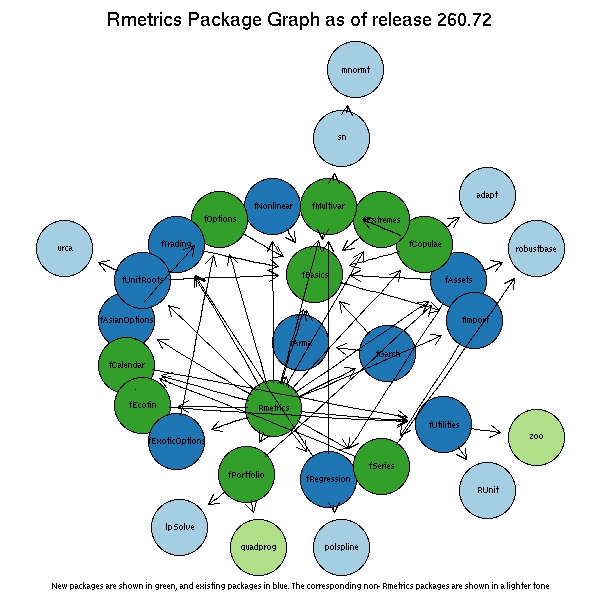
Rmetrics now comprosises over twenty individual packages. Eleven new packages were added in the 260.72 release for R 2.6.0, and they required eight other new packages from CRAN. While I would have preferred a more spread-out approach than the shotgun approach of having to introduce all these new packages at once (which took the last four weeks), I am in support of the reorganisation which should make maintenance more easy going forward.
So to get all of these packages onto a Debian box, a quick sudo apt-get
install r-cran-rmetrics is all it takes. Currently supported only in
the always-fresh unstable flavour, but hopefully soon in testing
too.
A big Thank You goes to the Debian FTPmasters. Of the 20-some packages that I added to Debian during this Rmetrics expansion, many were added within a day or two.
Lastly, thanks also to Florian Hahne, Robert Gentleman and Elijah Wright for much appreciated help with R's Rgraphviz and graph packages to create the chart above. It only takes a handful of lines to create the basic graph, and another few lines for the colours and titles. The code is available on request, of course, but you need the current development versions of the BioConductor packages Rgraphviz and graph (which are not in Debian yet).