More running data visualization
A few years into this running hobby, I realized that my times were getting better. But I had no feel for by how much, or whether that was a constant rate of improvement etc pp. Long story short, I started to plot some of the data. What seemed natural was to record the date, the distance in miles as well as in a qualitative variable, and finally the average pace. Additionally, I played with groupings into just three categories 'short', 'mid' and 'long'.This leads to a natural 'one-factor' model of pace as a function of race date grouped by race distance. And given how easy it is to do conditional plots in R, I quickly arrived at something that already resembled the following chart:
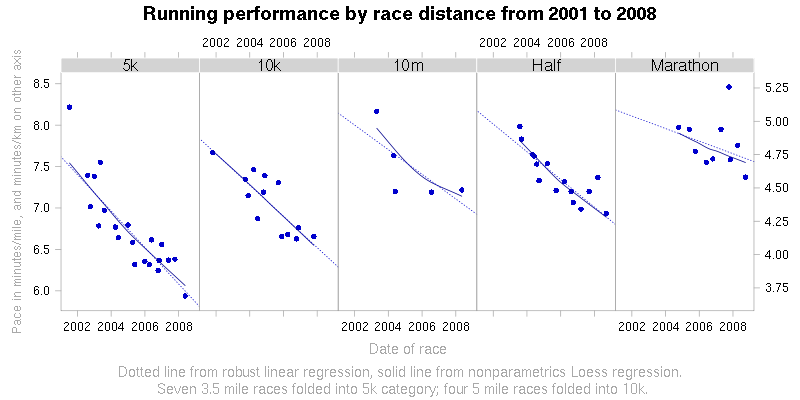
At first, some of the groups had too few data points to actually reliably construct regression lines, let alone non-parametric smoothers. But over time more and more data points were added as I kept running races. Including for example the somewhat disappointing result from last year's Chicago marathon in record heat that resulted in the outlier in the last panel. It actually made the smooth fit turn upwards! Luckily, the subsequent times in New York last fall, London in April, and of course in Berlin last month helped to dampen the effect of the one outlier, resulting in a more normal straight line for marathon performance that is comparable to the other four race lengths.
All in all I am now quite happy with the chart. The combination of the non-parametric loess smoother and the robust linear regression (using lrm
from the MASS package
for R)
shows that most groups exhibit very little non-linearity as both regression curves are very close to each other.
The curvature in the '10m' group is probably mostly a small-sample effect. And I am obviously happy with the
fact that three of the five panels show their respective last race as a PR :)
The R script containing the data and code is available here but requires some familiarity with the lattice package for R (as the lattice book would provide).