New CRAN package gunsales
This is based on joint work with Gregor Aisch and Josh Keller of the New York Times.
A new package gunsales is now on the CRAN network for R. It is based the NYTimes/gunsales repository underlying the excellent New York Times visualizations, first published first in December 2015 and updated with more recent data since.
The analysis takes public government data on gun sales from the National Instant Criminal Background Check System (NICS). The original data is scraped from the pdf, included in the package, and analysed in a cross-section and time-series manner. The standard US Census tool X-13ARIMA-SEATS is used to deseasonalize the timeseries at the national or state level. (Note that Buzzfeed also published data and (Python) code in another GitHub repo.)
As an aside, it was the use of X-13ARIMA-SEATS here -- and its somewhat awkward and manual installation also seen in the initial versions of the code in the NYTimes/gunsales repo -- which lead to the recent work by Christoph Sax and myself. We now provide a new package x13binary on CRAN so that Christoph's excellent seasonal package can simply depend upon it and have a working binary provided and installed ready to use; see the recent blog post for more. The net result is that a package like this new gunsales project can simply depend upon seasonal and also be assurred that x13binary "just works". As Martha would say, "A Good Thing".
Back to the gunsales project. Following the initial publication of the repository with the data and R code in a simple script, I felt compelled to reorganize it as a package. Packages for R, as we teach our students, colleagues, or anybody else who wants to listen are really the best way to bundle code, data, documentation (i.e. vignettes) and tests. All that exists now in the gunsales package.
The package now has one main function, analysis(), which returns a single dataframe object. This dataframe object can then be fed to two plotting functions. The first, plot_gunsales(), will then recreate all the (base R) plots from the original code base. The second, ggplot_gunsales(), does the same but via ggplot2.
This should give anybody the ability to look at the data, study the transformations done, form and maybe test new hypotheses and visualize in manner comparable to the original publication.
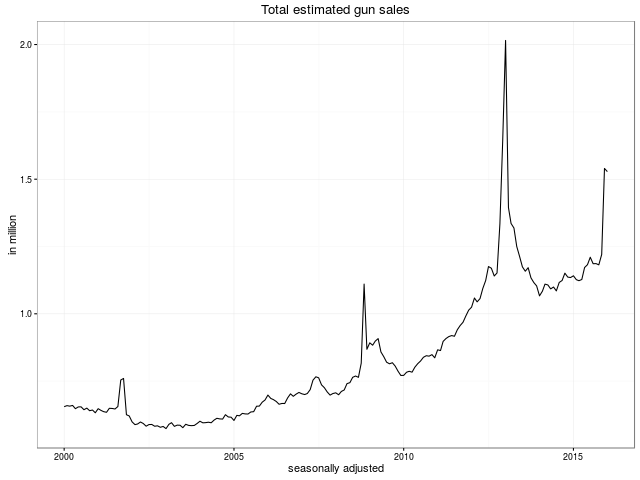
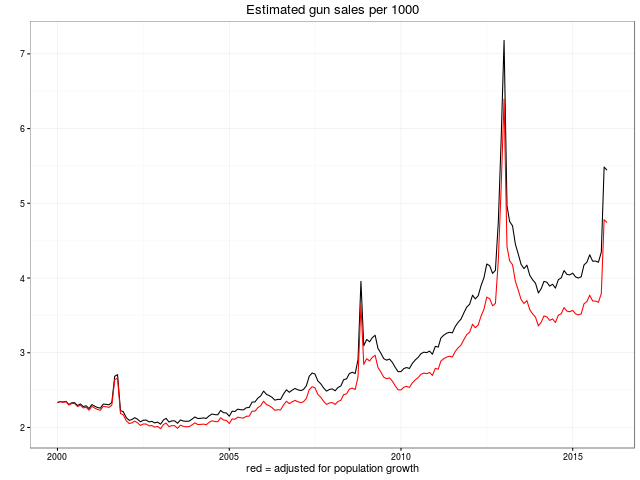
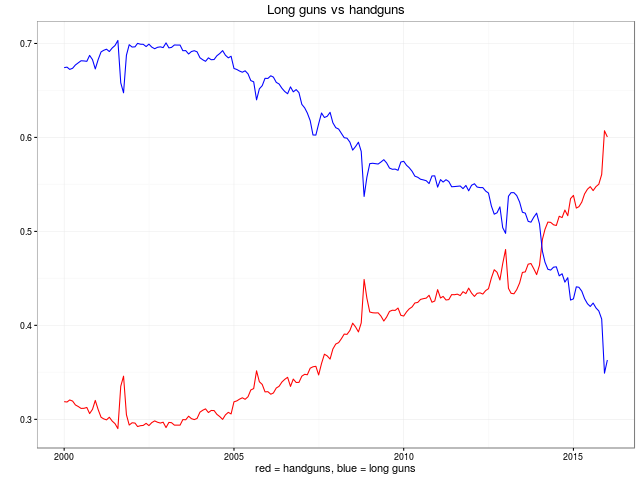
As an amuse gueule, here are the key plots also shown in the main README.md at GitHub:
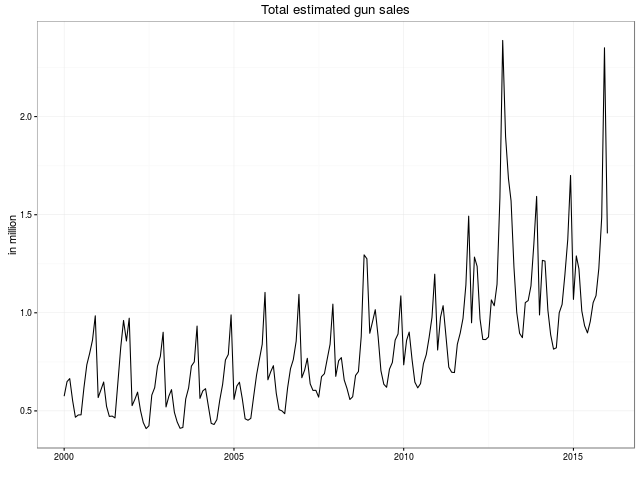
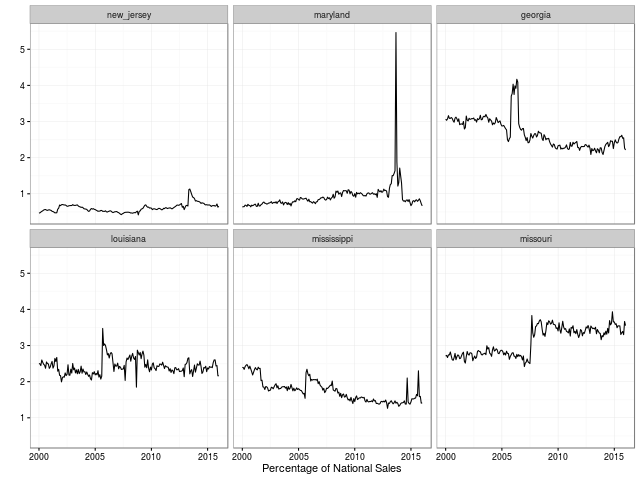
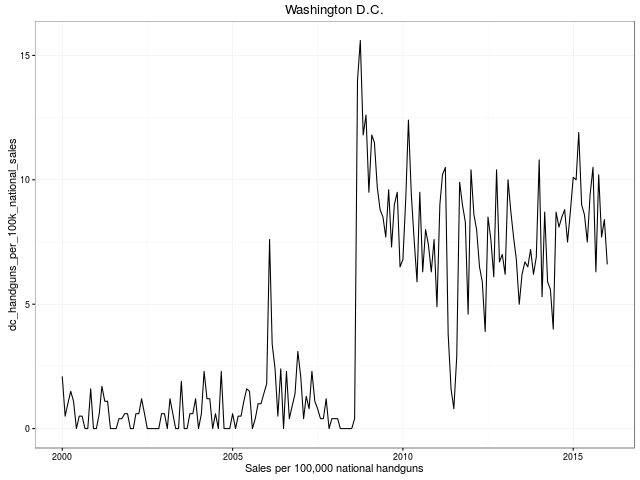
We look forward to more remixes and analysis of this data. The plan of the GitHub repository is to keep the data set updated as new data points are published.
This post by Dirk Eddelbuettel originated on his Thinking inside the box blog. Please report excessive re-aggregation in third-party for-profit settings.