An Ode to Stable Interfaces: R and R Core Deserve So Much Praise
A few days ago, a friend and I were riffing about the wonderful stability of R and (subsets of) R packages. The rigorous ASAN/UBSAN/Valgrind/… checks, while at times frustrating for us package maintainers when we do not have easily replicable setups [1], really help in ensuring code quality. As do of course all other layers of quality control at CRAN, and for R. In passing, I mentioned there was an older blog post demonstrating a little power-law-alike behaviour between the most frequent R Core committer and everybody else.
So I was intrigued. Could we just pick up a blog post I had written in August of 2007, or almost fourteen years ago, and run it as is? [2]
Yes, we can.
Which is truly, truly awesome.
Back then I must have taken a minor shortcut and analysed just one calendar year of SVN that was pre-extracted (and a few more still exists here if one scrolls down). Maybe then I might not have had the r-devel SVN repo checkout. But these days (and for probably a decade now) I do, and just a few lines of bash get us a full log:
#!/bin/bash

## adjust as needed
svn=${HOME}/svn/r-devel

rev=$(cd ${svn} && svn info --show-item revision)
today=$(date +%Y-%m-%d)

echo -n "Extracting ${rev} revisions at ${today} ... "
(cd ${svn} && svn log --limit ${rev} ) | gzip -9 > svn-log-${today}.txt.gz
echo "done"
So that leads to one code adjustments given the different input source. But otherwise the first paragraph runs as is (and now gives us 49.2% for the amazing Prof Ripley):
logfile <- "svn-log-2021-03-20.txt.gz"

## cf http://dirk.eddelbuettel.com/blog/2007/08/11/
x <- readLines(logfile)
rx <- x[grep("^r",x)]
who <- gsub(" ","",sapply(strsplit(rx,"\\|"),"[",2))
twho <- table(who)
twho["ripley"]/sum(twho)
That is what one gets by trusting stable interfaces: code untouched for fourteen years runs unchanged.
R itself has had well over sixty releases since then, including two major and eighteen minor releases. Yet the code just runs, including the code for two graphs one can reproduce with the exact same code as we show next.
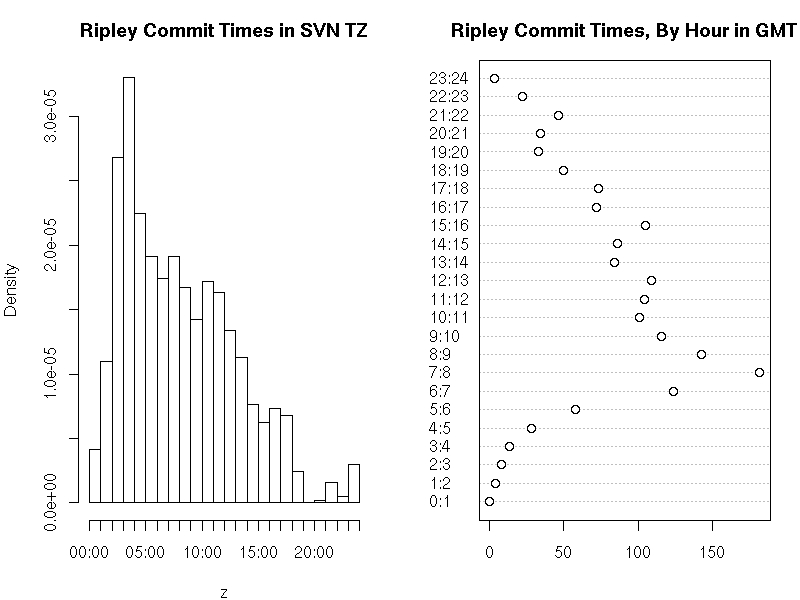
tod <- unlist(sapply(rx,function(x)strsplit(x,split=" ")[[1]][6]))
tod <- tod[who=="ripley"]

tz <- sub(pattern=".*(-[0-9]{4}).*",replacement="\\1",x=rx)
tz <- tz[who=="ripley"]
tz <- as.numeric(tz)/100
offset <- 3600*tz

z <- strptime(tod,format="%H:%M:%S")
hist(z,"hours",main="Ripley Commit Times in SVN TZ")

h <- z - offset
h <- format(h,format="%H")
h <- factor(as.numeric(h), levels=0:23)
## added as.vector() here to suppress a warning
dotchart(as.vector(table(h)), main="Ripley Commit Times, By Hour in GMT",
         labels=paste(0:23,1:24,sep=":"))
The code reproduces the chart from 2008, but this time uses the full twenty plus years of SVN history. I added just one as.vector() to suppress one new warning which appears under current R and which was presumably added in the fourteen years since (at the chart is produces without it too).
The remainder of the code also runs. I just added one library(zoo) my blog post had omitted. No other changes.
## rather extract both date and time
dat <- unlist(sapply(rx, function(x) {
txt <- strsplit(x,split=" ")[[1]]
paste(txt[5], txt[6])
}))
## subset on Prof Ripley
dat <- dat[who == "ripley"]
## and convert to POSIXct, correcting by tz as well
datpt <- as.POSIXct(strptime(dat,format="%Y-%m-%d %H:%M:%S")) - offset
## turn into zoo -- we use a constant series of ones as each
## committ is taken as a timestamped event
library(zoo)
datzoo <- zoo(1, order.by=datpt)
## and use zoo to aggregate into commits per date
daily <- aggregate(datzoo, as.Date(index(datzoo)), sum)
## now plot as grey bars
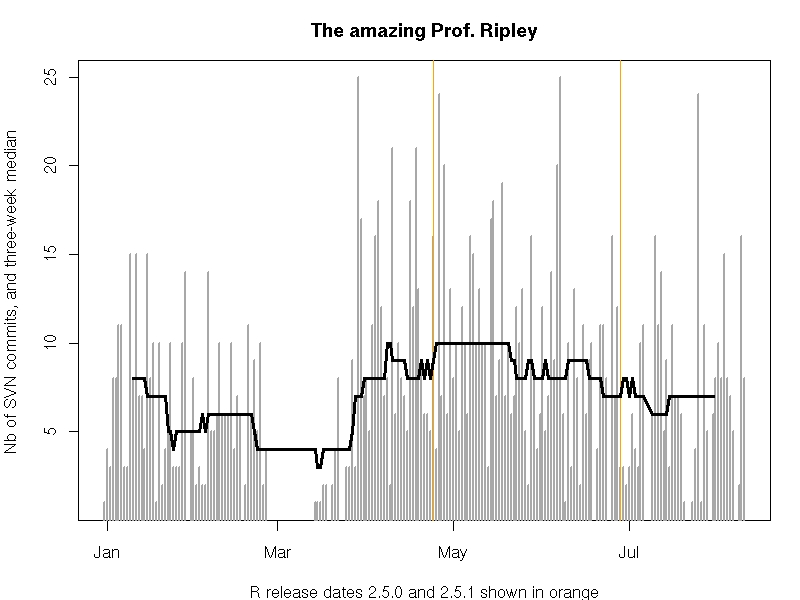
plot(daily, col='darkgrey', type='h', lwd=2,
ylab="Nb of SVN commits, three-week median",
xlab="R release dates 2.5.0 and 2.5.1 shown in orange",
main="The amazing Prof. Ripley")
## mark the two R releases of 2007
abline(v=c(as.Date("2007-04-24"),as.Date("2007-06-28")),col='orange',lwd=1.5)
## and do a quick centered rolling median
lines(rollmedian(daily, 21, align="center"), lwd=3)It produces this chart spanning two decades of commits. [3]
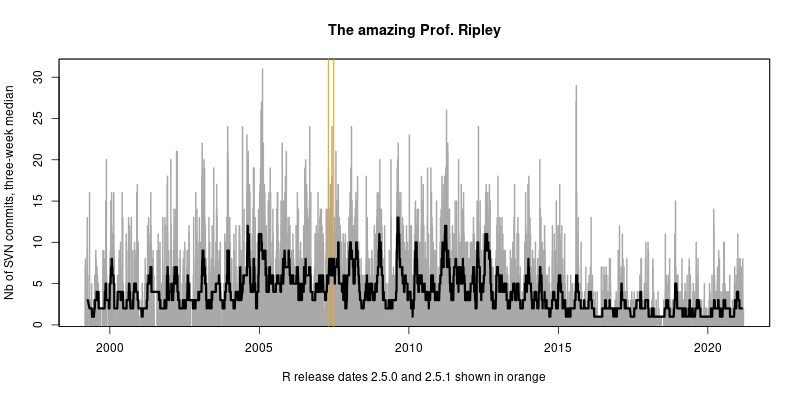
The subtitle highlighting the then-most-recent releases is a little quaint now given that R has had eighten major.minor releases, and over sixty total releases, since then.
Stable and rigourously maintained interfaces are a fantastic resource that is dramatically under-appreciated. Efforts such as the ten-year reproduction challenge demonstrate that this really is not a given. Maybe instead of celebrating band aides (“look, I reproduce via code I have frozen in a virtual environment / container / machine / …”) we should celebrate languages, ecosystems, packages, … that allow us to rely on just the code itself.
Because we can.
And we should strengthen and reinforce that ability. And discourage rapid changes just for changes’ sake. Code running for a decade, or even longer, is a huge boon to everybody relying on it.
Three cheers to R Core.
[1] Docker containers would be really good, and a step above the specs in the README. Winston’s nice r-debug “sumo” container comes closest and helps a lot, and is updated regularly (which my earlier r-devel-san container is not).
[2] The post owes some of its code ideas to Ben Bolker and Simon Jackman, but links to now-stale prior affiliations of theirs.
[3] And the singularly impressive contributions charted remain unparalled, but were already the focus of the previous post. Yet over three times as a long period, they remain even more stunning.
Edit 2021-03-21: Two minor fixes for grammar and typing.